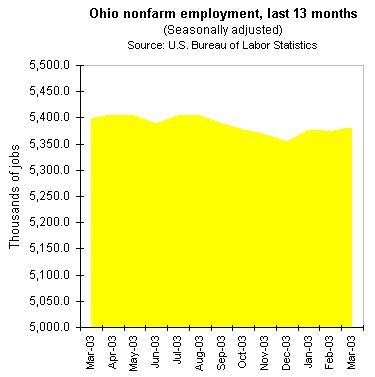
The U.S. Labor Department released state-by-state March employment statistics yesterday. Here's "Table 5. Employees on nonfarm payrolls by state and selected industry division, seasonally adjusted". Ohio's numbers: 5,381,400 jobs in March compared to 5,373,500 in February, 5,378,600 in January, and 5,398,100 in March 2003.

You gotta look pretty hard to see a recovery in that picture.
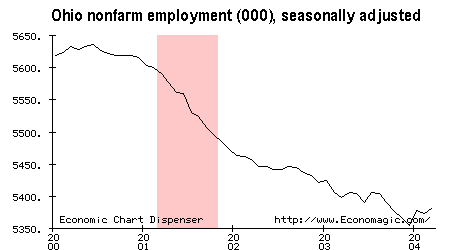
For the longer view of Ohio's recent experience, here's a chart generated by the incredible Economagic site. The pink area is the official national recession, which started in March 2001 and "ended" the following November.

The metro area numbers are supposed to be released Wednesday. For the story on greater Cleveland, stay tuned.